Last update : July 24, 2022
Spectrograms are visual representations of the spectrum of frequencies in a sound or other signal as they vary with time (or with some other variable). Spectrograms can be used to identify spoken words phonetically. The instrument that generates a spectrogram is called a spectrograph.
Spectrograms are approximated as a filterbank that results from a series of bandpass filters or calculated from the time signal using the Fast Fourier Transform (FFT).
FFT is an algorithm to compute the Discrete Fourier Transform (DFT) and its inverse. A significative parameter of the DFT is the choice of the Window Function. In signal processing, a window function is a mathematical function that is zero-valued outside of some chosen interval. The following window functions are common for spectrograms :
- Hann window function : good all-round frequency-resolution and dynamic-range properties
- Hamming window function : higher frequency resolution
- Kaiser window function : higher dynamic range
- Bartlett window function
- Rectangular window function
I recorded a sound example.wav file with my name spoken three times, to use as test file for different spectrogram software programs.
Real-Time Spectrogram Software
There are some great software programs to perform a spectrogram for speech analysis in realtime or with recorded sound files :
- Javascript Spectrogram
- Wavesurfer
- Spectrogram16
- SFS / RTGRAM
- Audacity
- RTS
- STRAIGHT
- iSound
Javascript Spectrogram
Jan Schnupp, sensory neuroscientist, former Professor at the Department of Physiology, Anatomy and Genetics within the Division of Medical Sciences at the University of Oxford, developed an outstanding javascript program to calculate and display a real-time spectrogram in a webpage, from the input to the computer’s microphone. It requires a browser which supports HTML5 and web audio and it requires also WebRTC, which is supported in recent versions of Chrome, Firefox and Opera browsers. WebRTC is a free, open project that enables web browsers with Real-Time Communications (RTC) capabilities via simple JavaScript APIs.
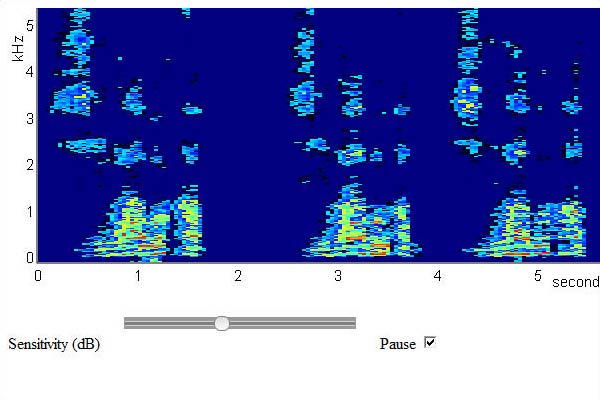
Javascript realtime spectrogram with 3x voice input “Marco Barnig” by microphone
Jan Schnupp is currently Professor of Neuroscience at the City University of Hong Kong. He is also the author of the website howyourbrainworks.net offering free, accessible introductory online lecture courses to neuroscience.
[HTML1]
Wafesurfer
WaveSurfer is an open source multiplatform tool for sound visualization and manipulation. Typical applications are speech/sound analysis and sound annotation/transcription. WaveSurfer may be extended by plug-ins as well as embedded in other applications. A comprehensive user manual and numerous tutorials for Wavesurfer are available on the net.
WaveSurfer was developed at the Centre for Speech Technology (CCT) at the KTH Royal Institute of Technology in Sweden. The latest stable Windows release (1.8.8p6, May 7, 2020) and the source code of WaveSurfer can be downloaded from Sourceforge. The authors of Wavesurfer are Jonas Beskow and Kåre Sjölander.
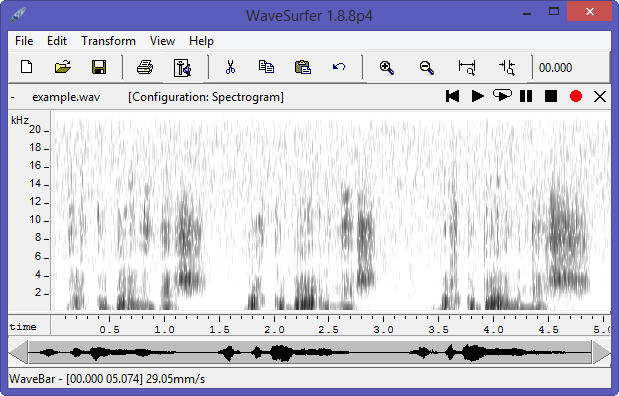
Wavesurfer auto-calculated, auto-sized spectrogram
By right-clicking in the Wafesurfer pane, a pop-up window opens with menus to add more panes, to customize the configuration and to change the parameters for analysis. In the following rendering, the panes Waveform, Pitch Contour, Formant Plot and Transcription have been added to the spectrogram pane and to the Time Axis pane. The spectrogram frequency range was cut at 5 KHz.
[HTML1]
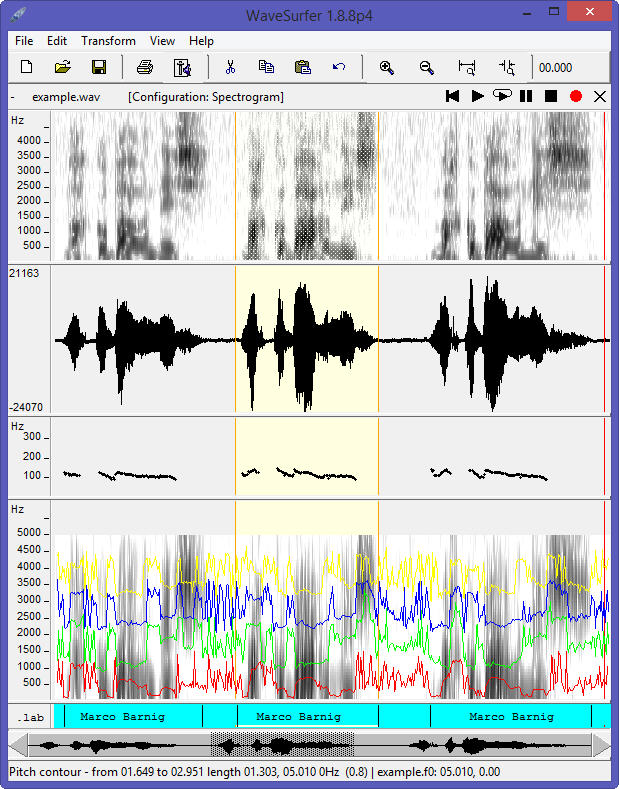
Wafesurfer customized
Two other panes can be selected: Power Plot and Data Plot. Additional specific panes can be created with plugins.
Wavesurfer uses the Snack Sound Toolkit created by Kåre Sjölander. There exist other software programs with the name Wavesurfer, for example wavesurfer.js, a customizable waveform audio visualization tool, built on top of Web Audio API and HTML5 Canvas by katspaugh.
Spectrogram16
Spectrogram16 is a calibrated, dual channel audio spectrum analyzer for Windows that can provide either a scrolling time-frequency display or a spectrum analyzer scope display in real time for any sound source connected to the sound card. A detailed user guide (51 pages) is joined to the program.
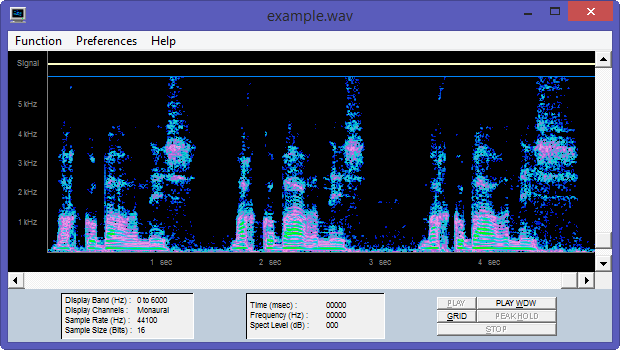
Spectrogram16 customized
The tool was created by Richard Horne, the founder of Visualization Software LLC. The company closed a few years ago. The WayBackMachine shows that Richard Horne announced in 2008 that version 16 of Spectrogram is now freeware (see also local copy). The software is still available from most free software download websites. Richard Horne, MS, who retired as a Civilian Electrical Engineer for the Navy, was member of the Management Team of Vocal Innovations.
The Spectrogram program was (and is still) appreciated by amateur radio operators for aligning ham receivers.
SFS / RTGRAM
RTGRAM is a free Windows program for displaying a real-time scrolling spectrographic display of an audio signal. With RTGRAM you can monitor the spectro-temporal characteristics of sounds being played into the computer’s microphone or line input ports. RTGRAM is optimised for speech signals and has options for different sampling rates, analysis bandwidths (wideband = 300 Hz, narrowband = 45 Hz), temporal resolution (time per pixel = 1 – 10 ms), dynamic range (30 – 70 dB) and colour maps.
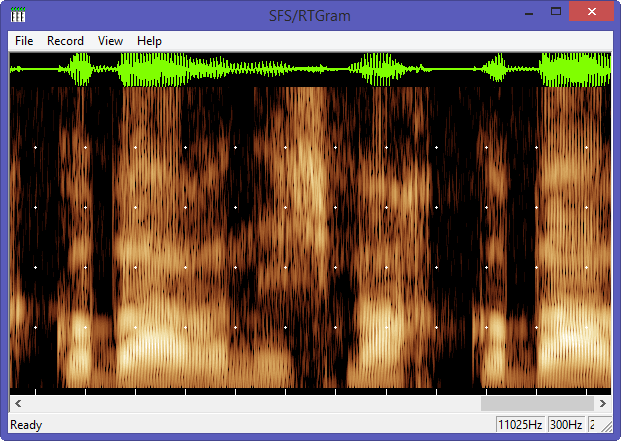
RTGRAM realtime spectrogram with 3x voice input “Marco Barnig” by microphone
The current version of RTGRAM is 1.3, released in April 2010. It is part of the Speech Filing System (SFS) tools for speech research.
RTGRAM is free, but not public domain software, its intellectual property is owned by Mark Huckvale, University College London.
Audacity
Audacity is a free, open source, cross-platform software for recording and editing sounds. Audacity was started in May 2000 by Dominic Mazzoni and Roger Dannenberg at Carnegie Mellon University. The current version is 3.0.3, released on July 26, 2021.
[HTML1]
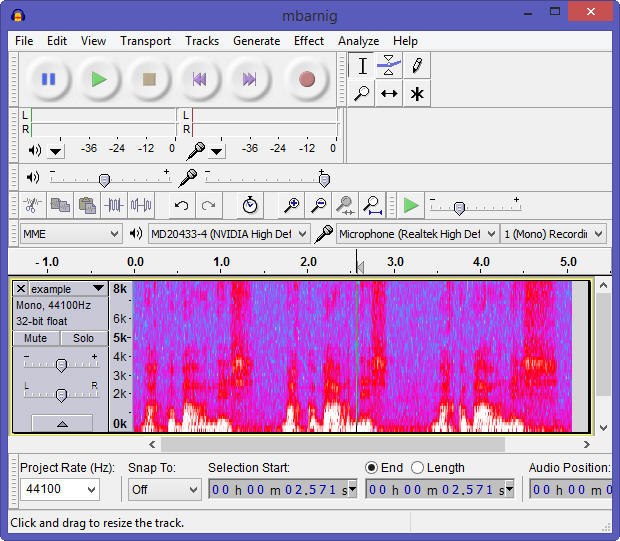
Audacity auto-calculated, auto-sized spectrogram
A huge documentation about Audacity with manuals, tutorials, tips, wikis, FAQ’s is available in several languages.
RTS tm
RTS (Real-Time Spectrogram) is a product of Engineering Design, founded in 1980 to address problems in instrumentation and measurement, physical acoustics, and digital signal analysis. Since 1984, Engineering Design has been the developer of the SIGNAL family of sound analysis software. RTS is highly integrated with SIGNAL.
STRAIGHT
STRAIGHT (Speech Transformation and Representation by Adaptive Interpolation of weiGHTed spectrogram) was originally designed to investigate human speech perception in terms of auditorily meaningful parametric domains. STRAIGHT is a tool for manipulating voice quality, timbre, pitch, speed and other attributes flexibly. The tool was invented by Hideki Kawahara when he was in the Advanced Telecommunications Research Institute International (ATR) in Japan. Hideki Kawahara is now Emeritus Professor from the Wakayama University, Japan.
iSound
Irman Abdić created an audio tool (iSound) for displaying spectrograms in real time using Sphinx-4 as part of his thesis at the Faculty of Mathematics, Natural Sciences and Information Technologies (FAMNIT) from Koper, Slovenia.
No Real-Time Spectrogram Software
Other great software programs to create no-realtime spectrograms of recorded voice samples are :
- Praat
- SoX
- SFS / WASP
- Sonogram Visible Speech
Praat
Praat (= talk in dutch) is a free scientific computer software package for the analysis of speech in phonetics. It was designed, and continues to be developed, by Paul Boersma and David Weenink of the Institute of Phonetics Sciences at the University of Amsterdam. Praat runs on a wide range of operating systems. The program also supports speech synthesis, including articulatory synthesis.
[HTML1]
Praat displays two windows : Praat Objects and Praat Picture.
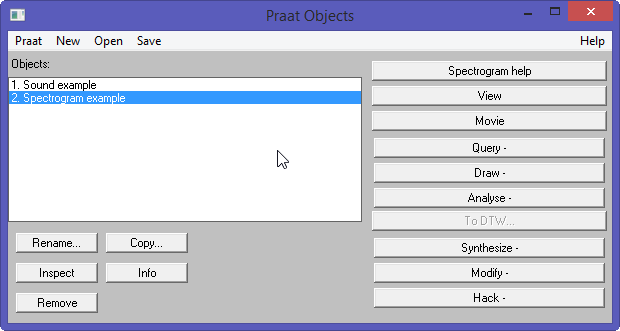
Praat Objects Window
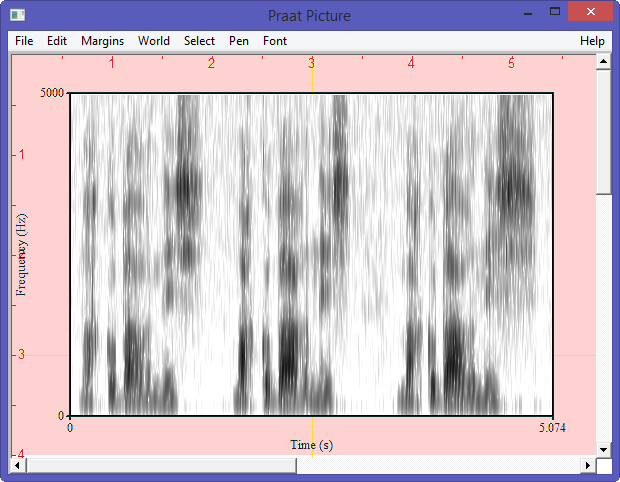
Praat Picture Window
The spectrogram can also be rendered in a customized window.

Praat customized window
The current version 6.1.51 of Praat was released on August 25, 2021. The source code for this release is available at Github. A huge documentation with FAQ’s, tutorials, publications, user guides is available for Praat. The plugins are located in the directory C:/Users/name/Praat/.
An outstanding plugin for Praat is EasyAlign. It is a user-friendly automatic phonetic alignment tool for continuous speech. It is possible to align speech from an orthographic or phonetic transcription. It requires a few minor manual steps and the result is a multi-level annotation within a TextGrid composed of phonetic, syllabic, lexical and utterance tiers. EasyAlign was developed by Jean-Philippe Goldman at the Department of Linguistics, University of Geneva.
SoX
SoX (Sound EXchange) is a free cross-platform command line utility that can convert various formats of computer audio files in to other formats. It can also apply various effects to these sound files and play and record audio files on most platforms. SoX is called the Swiss Army knife of sound processing programs.
SoX is written in standard C and was created in July 1991 by Lance Norskog. In May 1996, Chris Bagwell started to maintain and release updated versions of SoX. Throughout its history, SoX has had many contributing authors. Today Chris Bagwell is still the main developer.
The current Windows distribution is 14.4.2 released in February 22, 2015. The source code is available at Sourceforge.
SoX provides a very powerful spectrogram effect. The spectrogram is rendered in a png image-file and shows time in the x-axis, frequency in the y-axis and audio signal amplitude in the z-axis. The z-axis values are represented by the colour of the pixels in the x-y plane. The command
sox example.wav -n spectrogramcreates the following auto-calculated, auto-sized spectrogram :
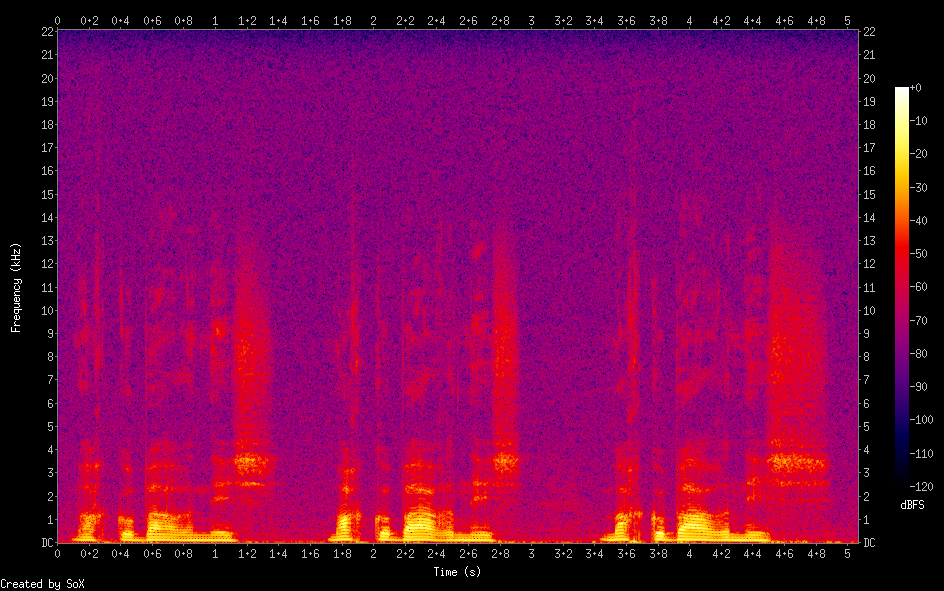
SoX auto-calculated, auto-sized spectrogram
The main options to customize a spectrogram created with SoX are :
-x num : change the width of the spectrogram from its default value of 800px
-Y num : sets the total height of the spectrogram; the default value is 550px
-z num : sets the dynamic range from 20 to 180 dB; the default value is 120 dB
-q num : sets the z-axis quantisation (number of different colours)
-w name : select the window function; the default function is Hann
-l : creates a printer-friendly spectrogram with a light background
-a : suppress the display of the axis lines
-t text : set an image title
-c text : set an image comment (below and to the left of the image)
-o text : set the name of the output file; the default name is spectrogram.png
rate num k : analyse a small portion of the frequency domain (up to 1/2 num kHz)
[HTML1]
A customized rendering follows :
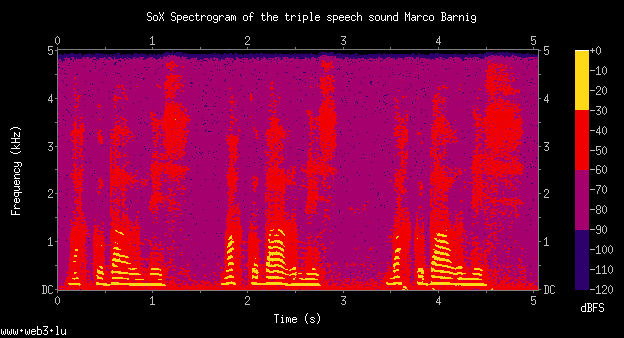
Customized SoX spectrogram
The customized SoX spectrogram was created with the following command :
sox example.wav -n rate 10k spectrogram -x 480 -y 240 -q 4 -c "www.web3.lu"
-t "SoX Spectrogram of the triple speech sound Marco Barnig"
WASP
WASP is a free Windows program for the recording, display and analysis of speech. With WASP you can record and replay speech signals, save them and reload them from disk, edit annotations, and display spectrograms and a fundamental frequency track. WASP is a simple application that is complete in itself, but which is also designed to be compatible with the Speech Filing System (SFS) tools for speech research. The current version 1.80 was released in June 2020.
[HTML1]
The following figure shows a customized WASP window with a speech waveform pane, a wideband spectrogram, a pitch track and annotations.
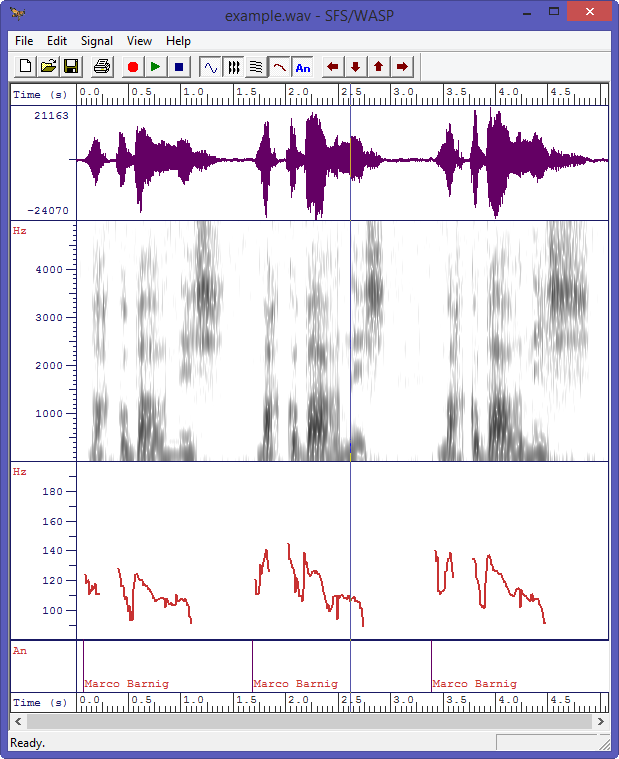
WASP customized spectrogram with pitch and annotation tracks
WASP is free, but not public domain software, its intellectual property is owned by Mark Huckvale, University College London.
[HTML1]
Sonogram Visible Speech
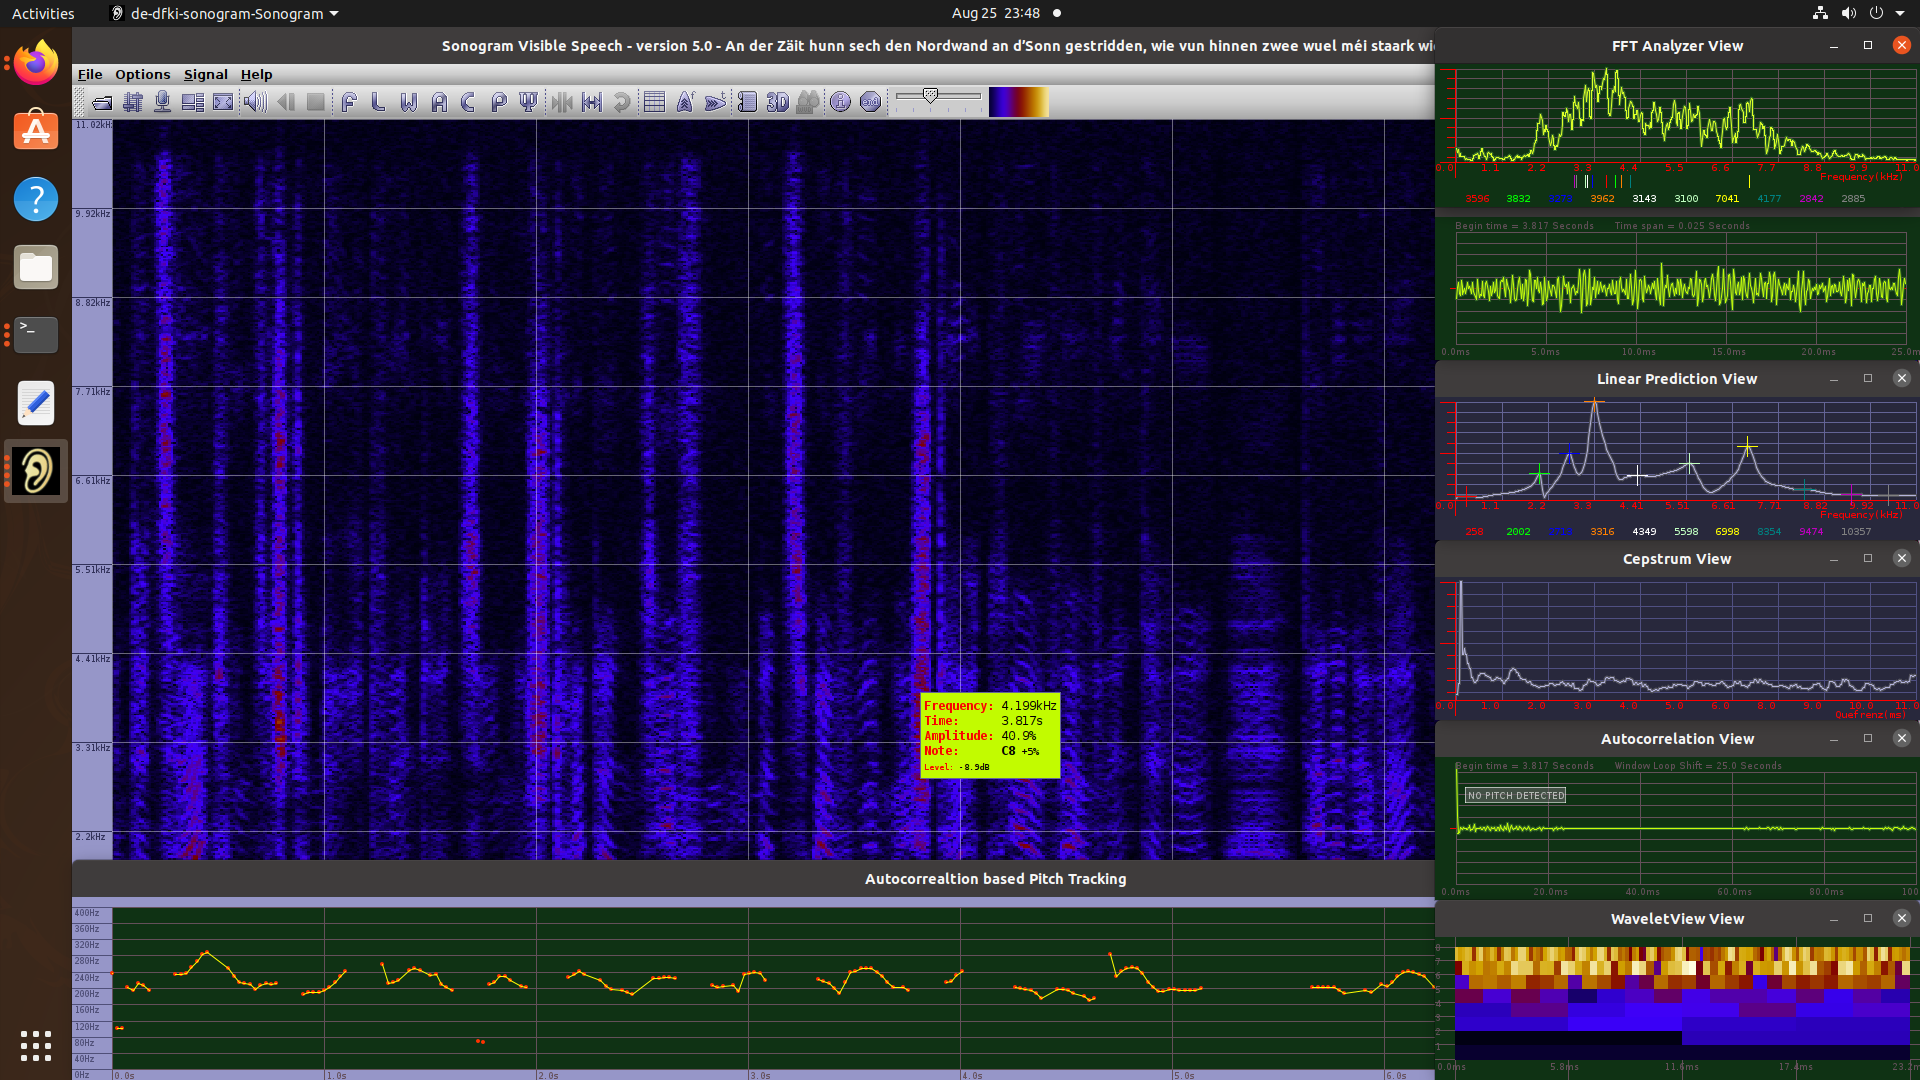
Sonogram Visible Speech is a very advanced program for sound, music and speech analysis. It provides multiple tools to perform various transformations and spectral studies on audio signals and to display the results in numerous panels : perspectogram, pitch, wavelet, cepstrum, 3D plots, auto-correlation charts etc.
In short terms, Sonogram is a powerful and complex audio spectrum analyzer with a comprehensive GUI layout.
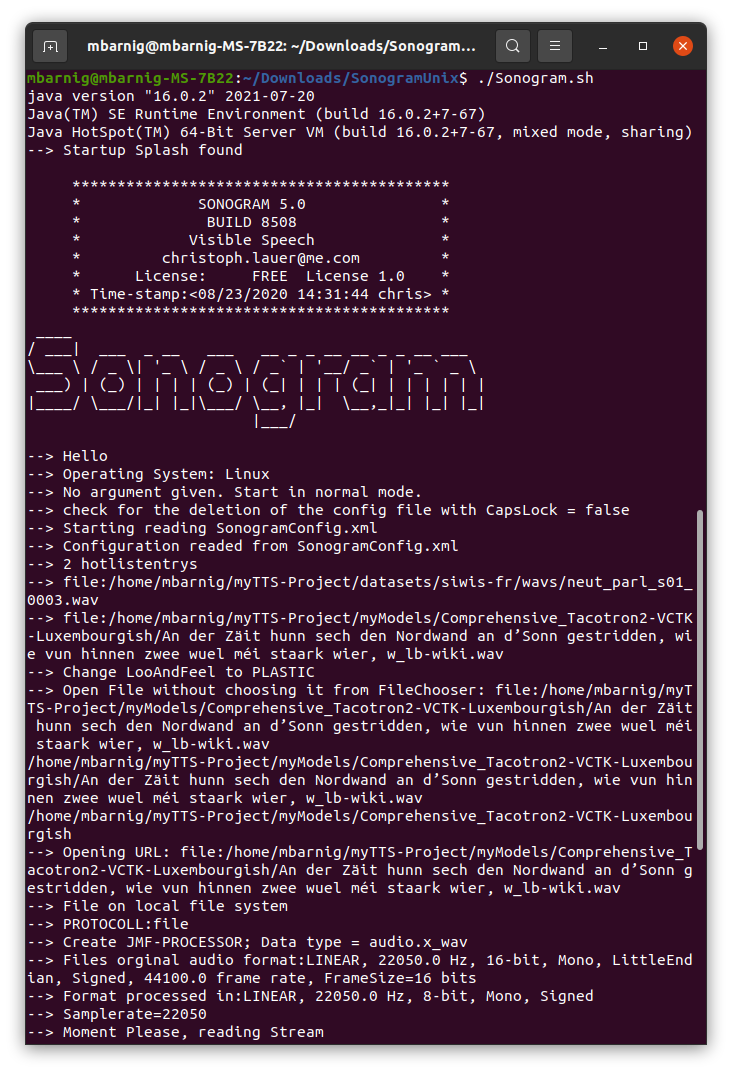
Sonogram is programmed in Java and needs Java Runtime in version 16 at least. It runs in Windows, MacOS and Unix/Linux. The current version 5 has been released in August 18, 2021. The source code is available at Github. The next figure shows the start of the program in a Linux terminal.
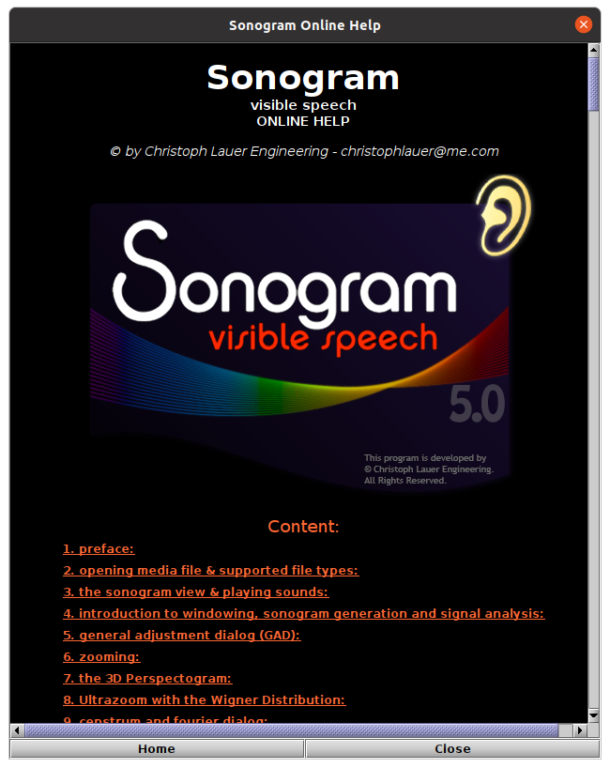
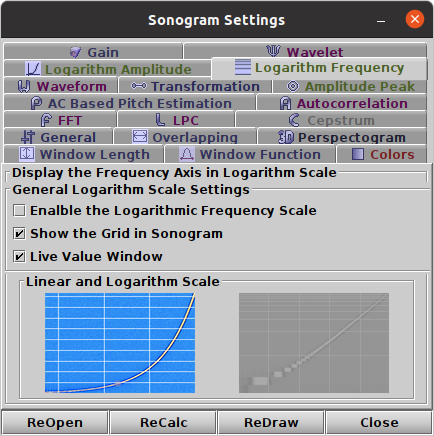
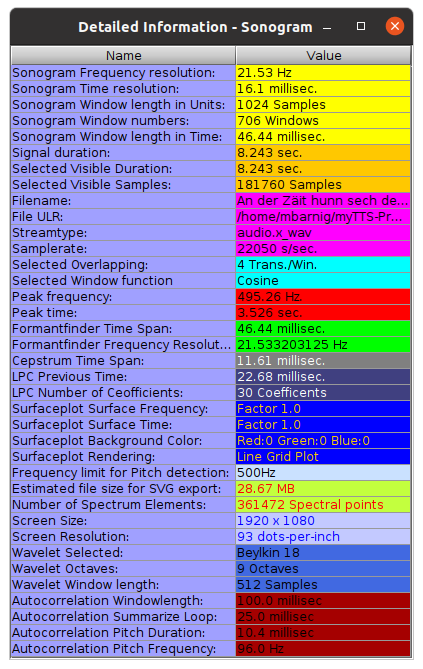
The following files show the help-, settings- and info-panels:
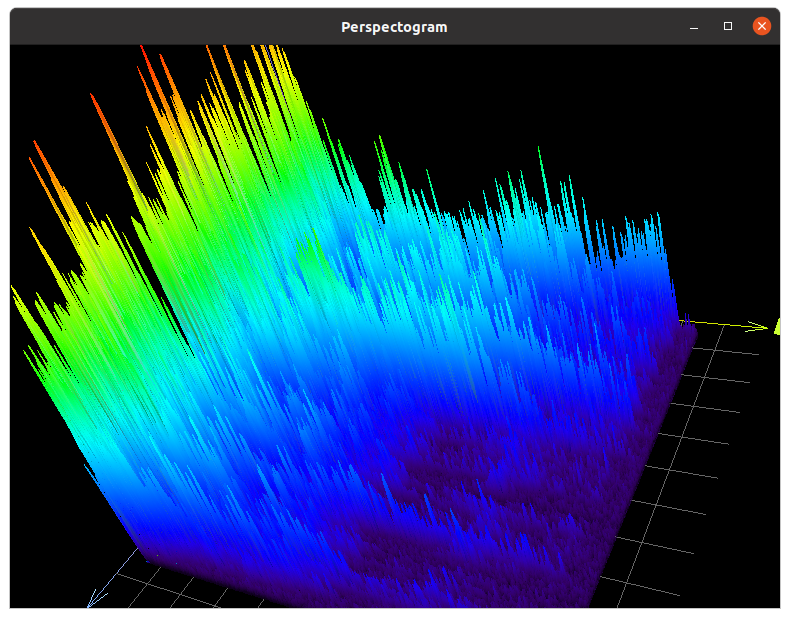
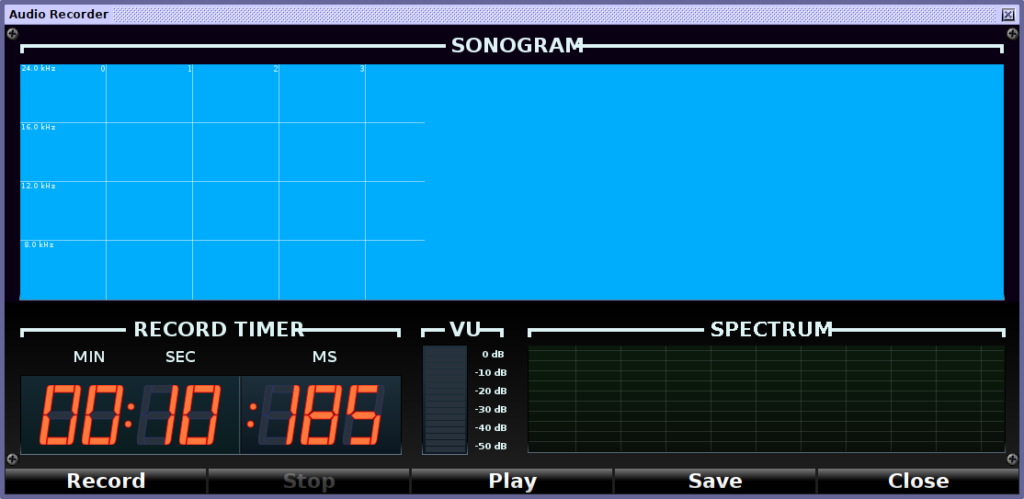
Sonogram includes a 3D-chart to present processed sound signals in three dimensions and a convenient audio recorder.
Sonogram Visible Speech was programed from 2000 to 2021 by Christoph Lauer. When he started the project he worked at the DFKI (Deutsches Forschungsinstitut für künstliche Intelligenz) in Saarbrücken. In December 2007 he joined the Saarland University as a scientific assistant, two years later the IDTM (Fraunhofer Institute for Digital Media Technology) as an Audio DSP Researcher. Since 2014 Christoph Lauer works as a Machine Learning Researcher for the BMW Group.
Specific Spectrogram Software
Spectrograms can also be used for teaching, artistic or other curious purposes :
- FaroSon
- SpectroTyper
- ImageSpectrogram
FaroSon
FaroSon (The Auditory Lighthouse), is a Windows program for the real-time conversion of sound into a coloured pattern representing loudness, pitch and timbre. The loudness of the sound is reflected in the brightness and saturation of the colours. The timbre of the sound is reflected in the colours themselves: sounds with predominantly bass character have a red colour, while sounds with a predominantly treble character have a blue colour. The pitch of the sound is reflected in the horizontal banding patterns: when the pitch of the sound is low, then the bands are large and far apart, and when it is high, the bands are narrow and close together. If the pitch of the sound is falling you see the bands diverge; when it is rising, you see the bands converge.
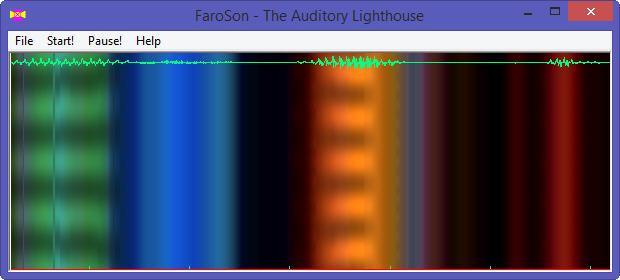
Faroson
FaroSon is free, but not public domain software, its intellectual property is owned by Mark Huckvale, University College London.
SpectroTyper
AudioCheck offers the Internet’s largest collection of online sound tests, test tones, and tone generators. Audiocheck provides a unique online tool called SpectroTyper to insert plain text into a .wav sound file. The downloaded file plays as cool-sounding computer-like tones and is secretly readable from a spectrogram view (linear frequency scale best). It can be used for fun, to hide easter eggs in a music production or to tag copyrighted audio material with own identifiers or source informations.
Here is the barnig_txt.wav sound file with my integrated name as an example, the result is shown below in the SoX spectrogram, created with the command :
sox barnig_txt.wav -n rate 10k spectrogram -x 480 -y 120
SoX Spectrogram of a sound with inserted text, synthesized with SpectroTyper
SpectroTyper and other audio tools and tone generators have been created by Stéphane Pigeon, a research engineer & sound designer from Belgium. He received the degree of electrical engineering from the Université Catholique de Louvain (UCL) in June 1994, with a specialization in signal processing. He finalized a PhD thesis in applied science in 1999. Then, Stéphane Pigeon joined the Royal Military Academy as a part-time researcher. In parallel, he worked as a consultant, exclusively for Roland Corporation in the area of the musical instrument market. He designed various audio-related websites, like AudioCeck.net started in 2007. He also released some iOS apps. His most succesful project is myNoise.net, started in 2013, which offers a unique collection of online noise generators.
ImageSpectrogram
Richard David James, best known by his stage name Aphex Twin, is an British electronic musician and composer. In 1999, he released Windowlicker as a single on Warp Records. In this record he synthesized his face as a sound, only viewable in a spectrogram.
Gavin Black (alias plurSKI) created a perl script to do the same : take a digital picture and convert it into a wave file. Creating a spectrogram of that file then reproduces the original picture.
[HTML1]
Here is the barnig_portrait.wav sound file with my integrated portrait as an example, the result is shown below in the SoX spectrogram, created with the command :
sox barnig_portrait.wav -n spectrogram -x 480 -y 480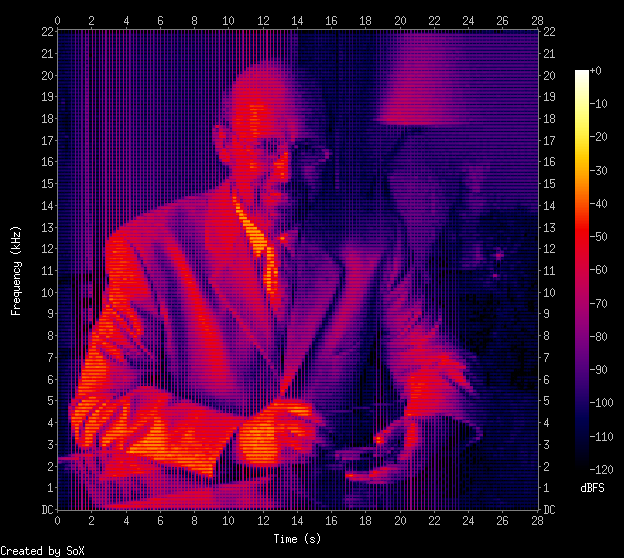
SoX Spectrogram of a sound with inserted picture, synthesized with imageSpectrogram
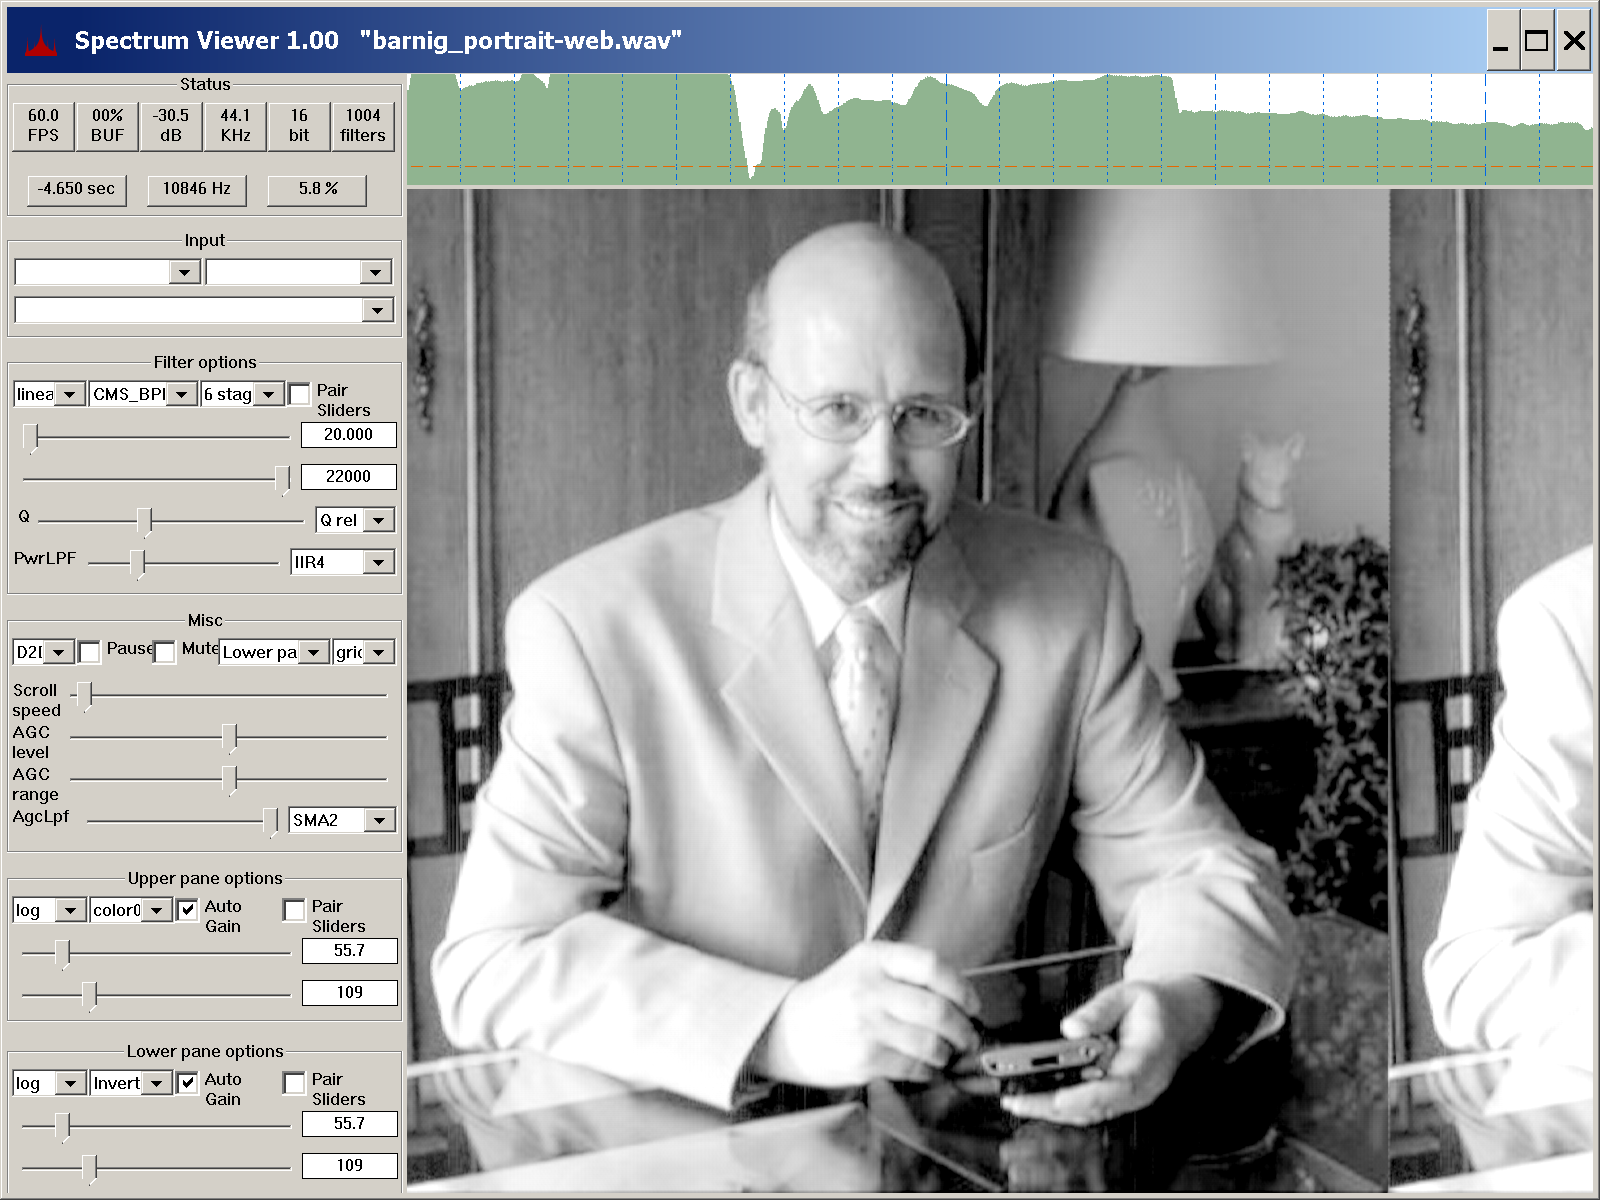
On July 24, 2022, Scott Duplichan published an Audio SpectrumViewer for Windows on Sourceforge. During the development he used the wav-sample with my embedded portrait to test his realtime spectrum viewer. Scott found a converter to create a better image with a smaller wav-file.
The spectrum viewer app contains a demo folder with an audioFileImage subfolder where you can start batch-files to compare the original with the improved spectrum. The result with the new converter is shown in the following screen-shot:
Links
A list with links to websites providing additional informations about spectrograms is presented below :
- Phonetics for Dummies, by William F. Katz
- Monthly Mystery Spectrogram webzone (2009), by Rob Hagiwara
- Why You Hear What You Hear, by Eric J. Heller
- Das Lesen von Sonagrammen, by Kirsten Machelett

